
The “final mile” of the inflation fight remains unconquered, and the Federal Reserve is now colliding with household balance sheets
- 2026 年 11 月 16 日
- 發布者: ACE Markets
- 類別: 財經新聞
Reading these three materials side-by-side reveals that they are actually discussing three facets of the same issue: October inflation exceeding expectations again, US household debt hitting a record high, and conflicting signals from within the Federal Reserve regarding the magnitude of interest rate hikes. ACE Markets, after cross-referencing household debt reports, CPI structure, official statements, and market pricing, concludes that the nature of this round of inflation has shifted from energy-driven to service and housing-driven; the household sector constitutes a micro-constraint on tightening: credit card balances reach $1.29 trillion, and new card interest rates are around 24%; Waller’s communication method, setting a hard threshold of 0.3%, has pushed market pricing from “cumulative 50 basis points” all the way to “75 basis points.” These three threads connect end-to-end, forming a complete cycle: inflation stickiness → household debt accumulation → rising interest rate expectations → debt cost backlash → risk of excessive tightening. Viewing any one link in isolation will lead to a misjudgment of the true policy space.
Energy conditions have eased, but the source of viscosity has changed.
The three sets of data provide a key cross-validation in terms of inflation structure: the easing of supply-side inflation and the stubbornness of core components occur simultaneously.
- Since the Federal Reserve held rates steady on October 28, international oil prices have fallen by nearly 20%, and the one-year inflation swap rate has fallen below 2%.
- However, the October CPI exceeded expectations again, and the prices of refined oil products such as diesel remained high, with signs of a renewed acceleration in rental housing costs (as clearly pointed out by Duta of Renaissance Macro).
- Meanwhile, price data accompanying the New York Fed report showed that prices for goods and services rose more than expected again in October.
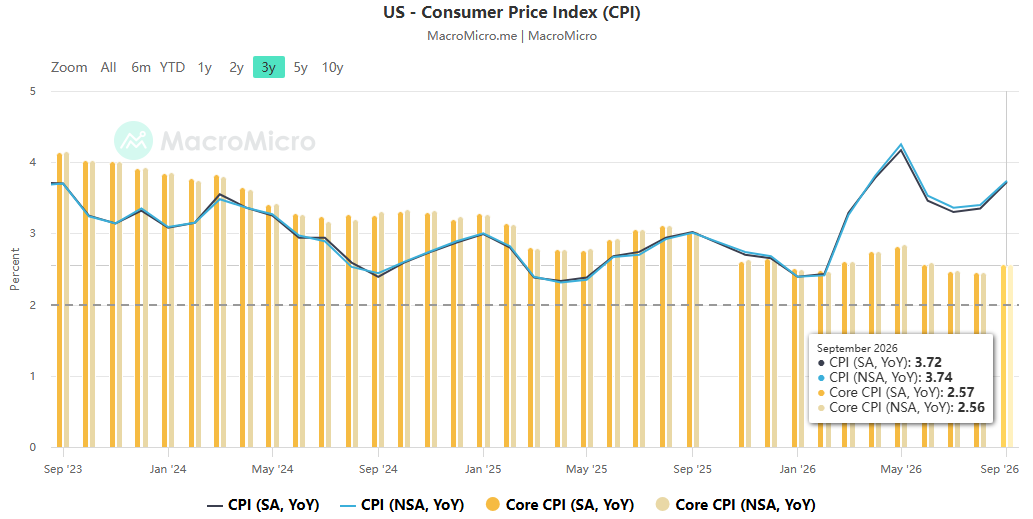
Combining the two sets of information, the conclusion is quite clear: the decline in oil prices has not led to a corresponding decline in inflation, because the pricing power of inflation has shifted from energy to refined oil products, housing, and services. The reason diesel prices haven’t followed the decline in crude oil prices lies in refinery capacity rather than crude oil supply—a link that has been repeatedly verified before and is also a channel for the lagging transmission of energy inflation. ACE Markets points out that this means the linear inference that “when oil prices fall, inflation will naturally improve” is no longer valid in the current cycle, depriving the Federal Reserve of a natural reason to wait.
Household balance sheets: The microeconomic costs of austerity are quantified.
Dutta’s assertion that “excessive tightening is a major risk to the US stock market in 2027” finds very solid micro-level evidence in household debt data. Comparing the two sets of data reveals a complete chain of pressure transmission:
- Credit card balances increased by $22 billion in the third quarter of 2026, reaching a record $1.29 trillion, a year-on-year increase of 4.2%.
- Total household debt increased by $334 billion to $19.1 trillion, also a record high, covering mortgages, car loans, and student loans;
- The average credit card balance per person was $6,678, and the number of cardholders increased from $174.8 million to $178 million.
- The average interest rate for newly issued credit cards is about 24%, which TransUnion calls “one of the most expensive ways to borrow money.”
- More and more new credit cards are going to borrowers with lower incomes and credit scores, and these accounts are more distressed; the aftereffects of the relaxed lending standards during the pandemic are now reflected in delinquency rates.
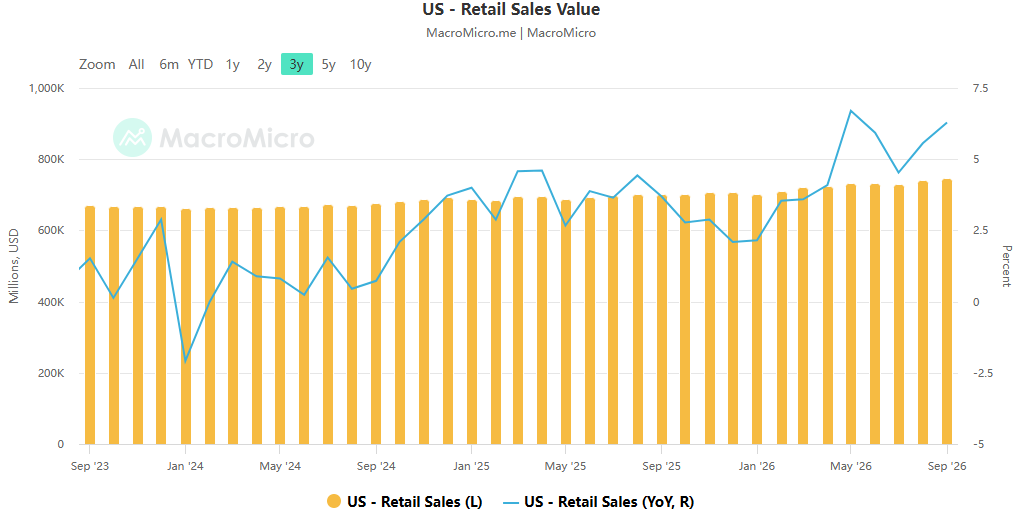
This data creates direct tension with the Federal Reserve’s interest rate hike direction: households are already using their most expensive resources to fill budget gaps, while policymakers are still discussing pushing up the cost of capital. ACE Markets believes this is precisely where “excessive tightening” transforms from an abstract risk into a measurable cost—every additional 25 basis points will be transmitted through credit card, auto loan, and mortgage rates to the already unbuffered household sector, ultimately impacting consumption and credit quality. The Century Foundation’s Moore interprets the midterm election results as “the economy failing to meet the needs of ordinary households,” adding a political dimension to this constraint: inflation itself is a source of pain for voters, and anti-inflation measures also affect voters’ wallets.
The Cracks in Policy Communication: 20 Basis Points Between 0.296% and 0.246%
The value of the third document lies in its revelation that the true source of market volatility is not inflation itself, but rather the mode of communication. Since taking office, Warsh has repeatedly emphasized the need to avoid over-reliance on forward guidance, opposed using single data points as the basis for decision-making, and even began to reform the Fed’s operations (reducing the number of annual meetings and adjusting the decision-making framework). However, Waller’s approach was exactly the opposite: he publicly set a 0.3% threshold for the core CPI monthly rate, and the data on that day happened to fall at 0.296% (rounded to 0.3%). The 2-year Treasury yield immediately jumped 19 to 20 basis points to 4.75%, and market expectations for subsequent cumulative rate hikes rose from 50 basis points to 75 basis points.
McGiffer’s hypothesis best illustrates the problem: if the monthly reading is 0.246%, rounded to below the threshold, would the 20-basis-point jump, and the pricing of “three 25-basis-point jumps instead of two,” still occur? He believes it’s unlikely. ACE Markets concludes that the market is pricing in “the uncertainty of policy communication” rather than the inflation level. When a statistical error of 0.05 percentage points can rewrite the entire interest rate path, the stability of pricing has already been undermined by the communication method itself. This also explains why officials like Hamak favored a gradual approach, while Waller abruptly changed course (from voting twice for rate cuts to considering a 50-basis-point rate hike within seven months). Internal, diverse discussions manifested as contradictory signals, which the market could only interpret individually. Walsh’s philosophy of “looking at trends, not individual points” contrasts sharply with his team’s actual communication—this contrast itself is the reason for the rise in short-term volatility.
Expected Steps: A Three-Tier Progression of Officials, Markets, and Economists
By arranging the expected figures from the three sets of materials side by side, a clear ladder can be seen:
The Fed’s September dot plot: a cumulative 50 basis point rate hike in the future;
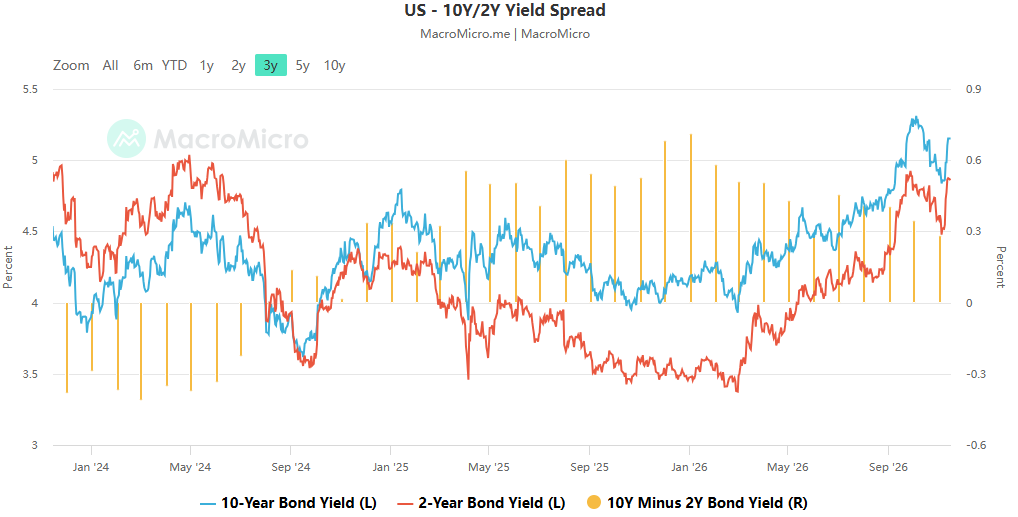
Market pricing: The yield rose to 75 basis points after Waller’s speech, with the 2-year yield at 4.75% and the 10-year yield returning to 5%.
Economists believe that Dutta argues that “only withdrawing last year’s 75-basis-point insurance rate cut is the bare minimum.”
The three-tiered progression illustrates that the disagreement is no longer about “whether to raise interest rates,” but rather about where the final interest rate will be. More noteworthy is the widening gap between the 2-year yield and the policy rate—this is bond investors putting pressure on the Federal Reserve, rather than passively following suit. ACE Markets believes that this “market-led, official-reinforced” pattern will give each subsequent data release a policy impact greater than before, meaning the front end of the yield curve will continue to be the main source of volatility.
Scenario simulation and tracking checklist
Baseline scenario: A 25 basis point rate hike in December, with the cumulative path gradually approaching 75 basis points; the 10-year yield fluctuating around 5%; the 2-year yield oscillating at a high level; and the yield curve remaining relatively flat.
上行風險: If rents continue to rise at par with landlords and refined oil prices remain high, the probability of a 50 basis point increase will substantially rise, the short end will surge again, the curve will flatten further, high-valuation growth stocks and the AI chain will be under pressure, and at the same time, household credit indicators (delinquency rate, credit card issuance standards) will begin to deteriorate significantly.
下檔風險: The cooling of AI will be transmitted to the real economy through employment and credit quality, leading to an increase in credit card and auto loan defaults, forcing the Federal Reserve to slow down its pace, resulting in a decline in short-term interest rates and a correction of the steepening yield curve.
It is recommended to prioritize tracking five sets of interrelated signals: rent and OER month-on-month, diesel prices and global refinery operating rates, credit card delinquency rates and new card issuance standards, the 2s-10s interest rate spread, and Walsh’s own explicit statements. The first two determine whether the “last mile” of inflation can be cleared, the middle two determine the social tolerance for tightening, and the latter two determine whether the anchor of market expectations is stable.
總結
The three sets of materials, presented side-by-side, reveal different facets of the same predicament: the stickiness of inflation has shifted, household balance sheets have been compressed to a critical point, and the way policy communication amplifies each data shock. Therefore, the Fed’s real challenge is not “whether or not to raise interest rates,” but rather “how steep the slope the economy and households can withstand on the path of inflation returning to 2%.” ACE Markets adheres to a cross-data source, cross-sector, and cross-market cross-validation framework—placing CPI structure, household debt, official statements, historical data, and market pricing on the same transmission chart—to identify constraints invisible from a single perspective and to determine the interest rate path and asset allocation, rather than being swayed by a mere 0.05 percentage point reading.
 Chinese
 English
 Vietnamese
 Hindi
 Japanese
 Thai
 Korean