The market trend under the resonance of the US stock valuation bubble and the interest rate cut cycle ! In-depth analysis of the current bull-bear game !
- September 26, 2025
- Posted by: Ace Markets
- Category: Financial News
Federal Reserve Chairman Powell’s remarks at a public event in Rhode Island, calling US stocks “extremely richly valued,” sent shockwaves through the market. Market concerns about the sustainability of AI trading have also exacerbated the recent weakness in US stocks. Many strategists agree with Powell’s view, as the S&P 500 and Nasdaq have risen steadily over the past three years, with several core valuation metrics reaching record highs. Powell is not the first Fed chairman to warn of valuation risks in US stocks, as he cites the concept of “irrational exuberance” coined by Alan Greenspan in 1996. After Greenspan’s comments, US stocks continued to rise for more than three years before peaking. Whether the current US bull market will repeat this trend remains to be seen.
Three core valuation indicators highlight the valuation pressure of US stocks
Judging from specific valuation indicators, the current high valuation characteristics of US stocks have become relatively clear, and many indicators widely used by the market have released warning signals.
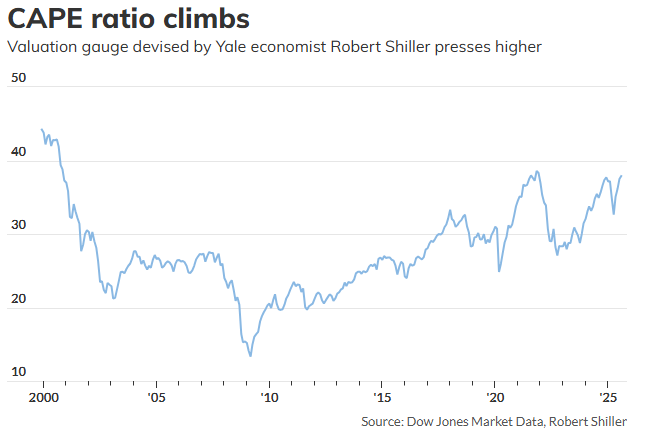
CAPE Ratio: Breaking Through a Key Level, Approaching Dot-com Bubble Levels
The CAPE ratio (cyclically adjusted price-to-earnings ratio) is a key indicator of long-term stock market valuations. It compares the S&P 500 index to the average inflation-adjusted earnings of its constituents over the past decade, eliminating the impact of short-term fluctuations. Since the beginning of this bull market, the ratio has continued to climb: nearing 38 at the end of August, reaching its highest level since the end of 2021. More importantly, experts point out that it has broken through 40, matching the level seen during the bursting of the dot-com bubble in 2000. Given the recent rally in US stocks, this figure is likely to rise further.
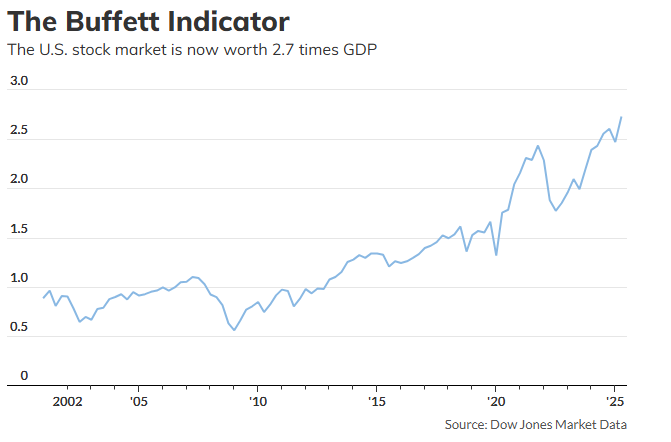
The “Buffett Indicator”: The ratio of stock market capitalization to GDP has reached its highest level since 2001
The “Buffett Indicator” is composed of the ratio of total stock market capitalization to US GDP. Buffett has called it the best measure of valuation. According to Dow Jones data, as of the end of June, the total market capitalization of the US stock market was approximately $64.5 trillion, and the US GDP in the second quarter was $23.7 trillion. The current valuation of US stocks is approximately 2.7 times GDP, the highest since March 2001. Although Buffett does not recommend “market timing,” the market still regards this indicator as an important reference. Corporate earnings are highly correlated with economic activity, and this indicator can directly reflect whether valuations are out of line with economic fundamentals.
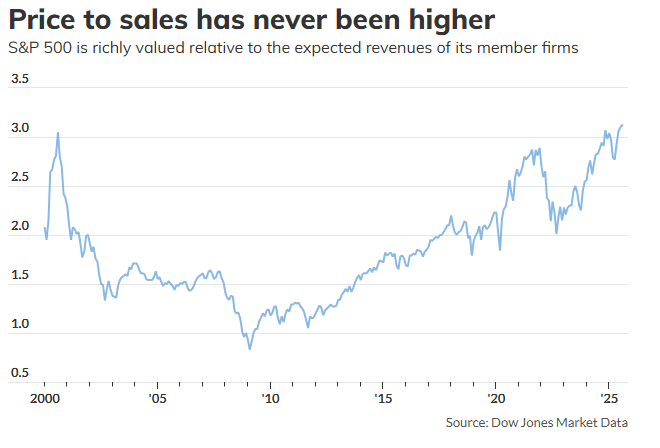
Price-to-sales ratio: S&P 500 hits record high relative to expected sales
The price-to-sales ratio is considered a more objective valuation metric because it’s less susceptible to accounting manipulation. Data shows that as of the end of August, the S&P 500’s projected price-to-sales ratio for the next 12 months reached 3.12, a new high since 2000. However, given that US corporate profit margins are currently near record highs, the comparability of this metric with historical data has decreased, necessitating more cautious risk assessment. Furthermore, Wall Street research indicates that short-term valuations are of limited use in predicting market trends over the next 12 months, requiring a comprehensive assessment based on multiple factors, including policies and earnings.
The Federal Reserve’s interest rate cut policy: a “bullish signal” or a “risk variable” for the future of the US stock market?
Amidst ongoing valuation debates, the Federal Reserve’s interest rate cut decision remains a key variable influencing the outlook for the US stock market. LPL Financial’s analysis indicates that following the Fed’s rate cut announcement last week, the market is likely to maintain a bullish trend, even though US stocks are currently near historical highs.
Historical data: The probability of a positive return on US stocks in the 12 months after a rate cut exceeds 90%.
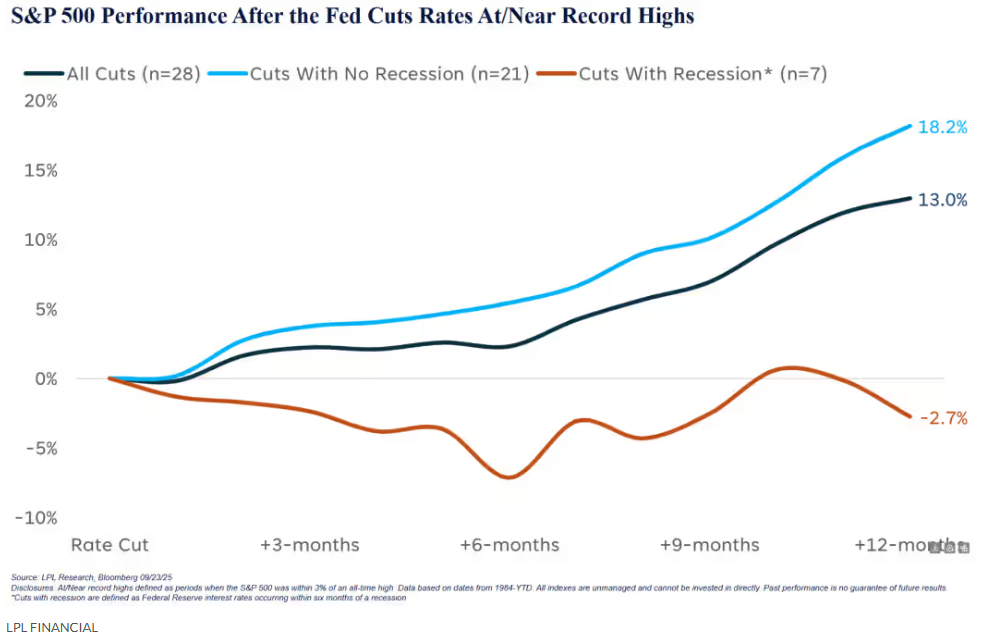
LPL Chief Technical Strategist Adam Turnquist reports that since 1984, the Federal Reserve has cut interest rates 28 times when the S&P 500 index was within 3% of its all-time high. The index has averaged a 13% gain 12 months after the cuts, with positive returns 93% of the time. Turnquist noted that the current recession risk is low, and historical patterns suggest a bullish market in the absence of a recessionary interest rate cut cycle. US economic data also provided support, with real GDP growing at an annualized rate of 3.3% in the second quarter and projected to remain at 3.3% in the third quarter.
Looking more closely, whether there is an economic recession or not significantly affects market performance: 21 interest rate cuts were not accompanied by a recession, and the S&P 500 index had an average 12-month return of 18%, all of which were positive returns; 7 interest rate cuts overlapped with a recession (within 6 months before and after the recession), and the index fell an average of 2.7% in 12 months, with only 25% of the periods rising.
Institutional view: optimistic about long-term trend, be wary of short-term overbought
Turnquist noted that the economy is expected to grow moderately thanks to a low federal funds rate, stimulus from the “Big, Big” bill, and rising productivity, driving the S&P 500 index up 12.9% this year and reaching new highs. However, he cautioned that the overbought market and diverging breadth of market activity suggest a possible short-term correction, which could be seen as a buying opportunity. He also cautioned against slowing economic growth and a weakening labor market. Samana also believes that there is a partial “bubble” in the US stock market and recommends taking advantage of any correction. He predicts that the S&P 500 will continue to rise next year, driven by expectations of a Fed rate cut and AI spending. He is particularly optimistic about sectors like technology and finance that are nascent into AI and are poised to benefit from technological change.
Conclusion: The balance between high valuations and favorable policies is the key to the future of US stocks
The US stock market is currently caught in a tug-of-war between high valuation pressure and favorable policy support. Core indicators like the CAPE ratio suggest elevated valuations, and Powell’s warnings raise concerns about bubble risks. However, the Fed’s consistent rate cuts, economic expansion, and the potential for AI growth provide further support for a bullish outlook. Investors need to strike a balance between these two factors: in the short term, be wary of overbought pullbacks and seize opportunities to buy on dips; in the long term, monitor economic recession, corporate earnings realization, and monetary policy adjustments.